The Stride Ledger: Tracking Your Prosthetic Interface
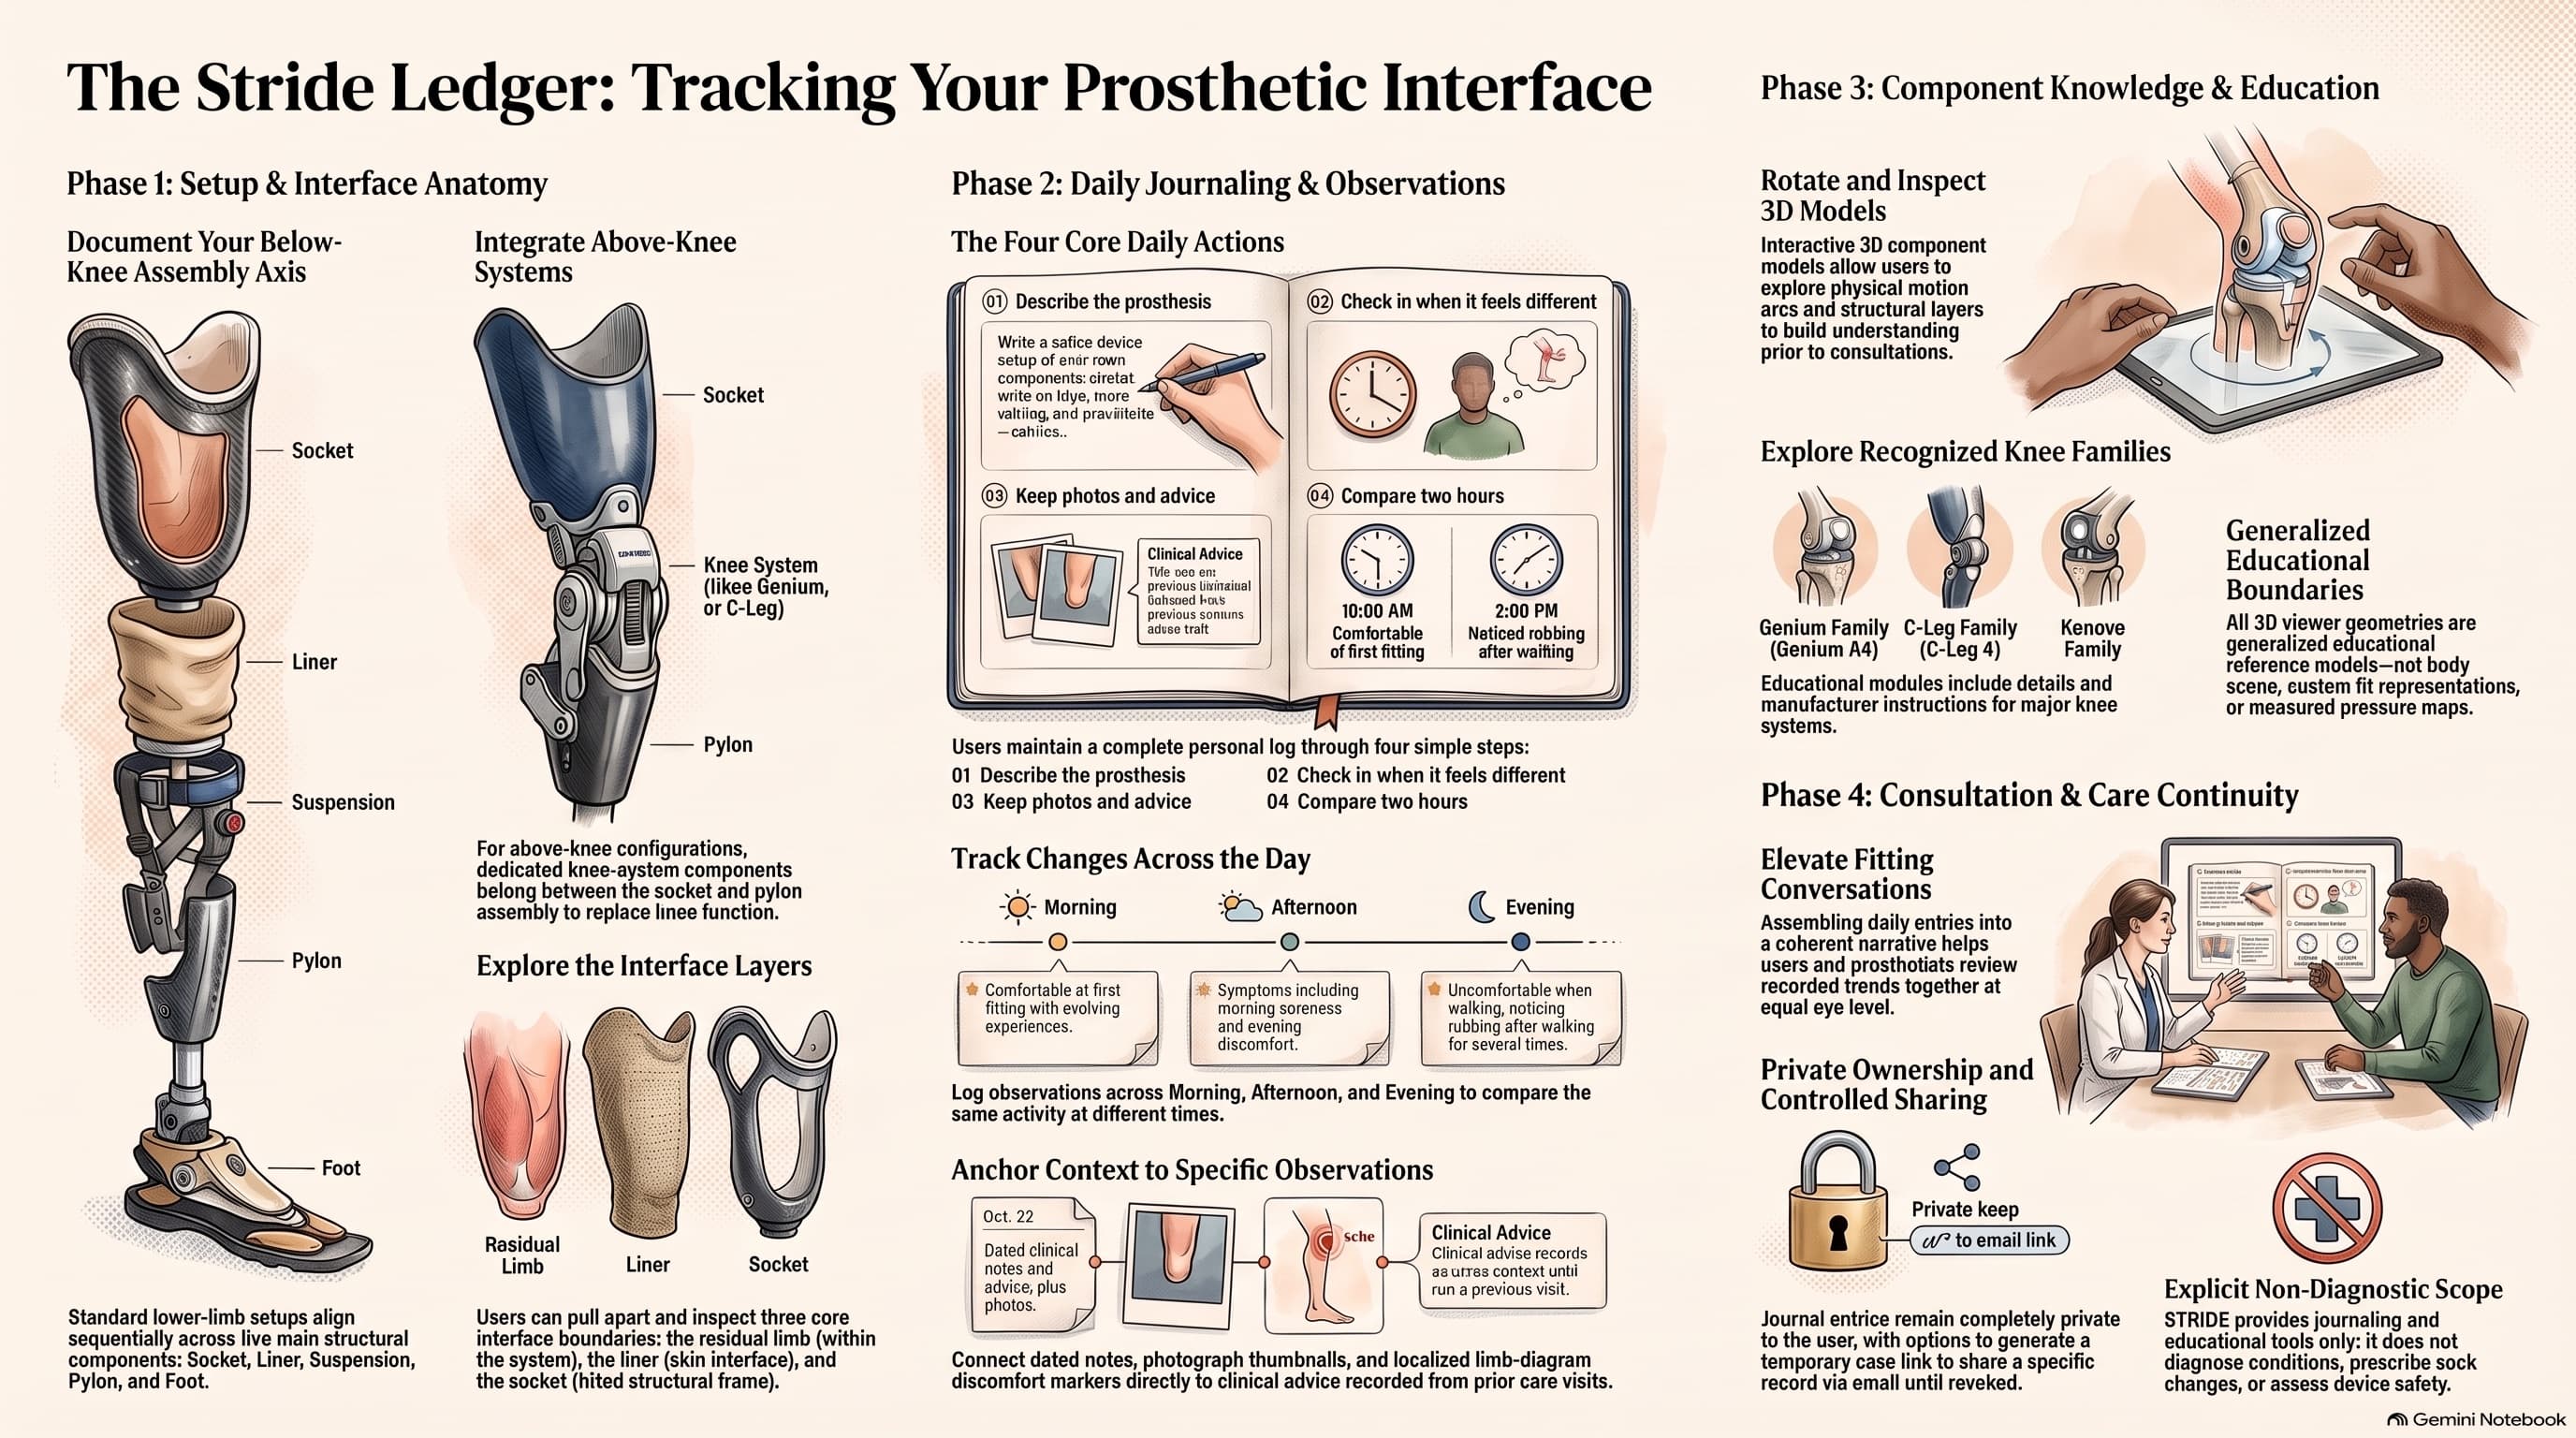
A visual blueprint of STRIDE — the personal prosthesis notebook that gives wearers a structured way to document socket fit, track changes across a day, explore component anatomy, and prepare evidence-based conversations with their prosthetist. The infographic maps four phases: setup and interface anatomy, daily journaling, component knowledge, and care continuity.
Most prosthetic infographics show the device from the outside. This one shows it from the inside — the layers between the residual limb and the world, and the four-phase system that helps the wearer understand, document, and communicate what happens at that interface every day.
STRIDE is not a clinical tool. It is a personal ledger. The infographic maps how the wearer uses it: learn the anatomy, journal the daily experience, explore the components, and carry the record forward into every conversation with the care team.
Phase 1: Setup & Interface Anatomy
The infographic begins at the left with the physical reality: what the wearer is actually wearing.
Document your below-knee assembly axis. The infographic maps the five main structural components sequentially — socket, liner, suspension, pylon, and foot — showing how each layer connects to the next in the below-knee configuration.
Integrate above-knee systems. For above-knee configurations, dedicated knee-system components belong between the socket and pylon assembly to replace knee function. The infographic shows the socket, knee system (like Genium or C-Leg), and pylon in the AK axis.
Explore the interface layers. This is the critical section. Users can pull apart and inspect three core interface boundaries: the residual limb (within the system), the liner (the skin interface), and the socket (the structural frame). Standard lower-limb setups align sequentially across five main components. Understanding what sits where — and what each layer does — is the foundation for every observation that follows.
Phase 2: Daily Journaling & Observations
The centre of the infographic maps the four core daily actions:
01: Describe the prosthesis. Write a surface description of the main components: material, colour, key features, walking and prosthetic notes. This baseline makes every subsequent entry interpretable.
02: Check in when it feels different. Log the location of discomfort, the activity context, and what changed. Clinical advice (documented from consultations) is stored alongside personal observations.
03: Keep photos and advice. Annotate photos with dated notes, photograph thumbnails, and localised line-diagram discomfort markers linked directly to clinical advice recorded from prior care visits.
04: Compare two hours. The infographic shows a morning entry (10:00 AM — comfortable at first fitting with evolving experiences) alongside an evening entry (7:00 PM — uncomfortable when walking, noticeable rubbing after walking for several times). Log observations across morning, afternoon, and evening to compare the same activity at different times.
Track changes across the day. The timeline visualization shows how symptoms evolve: comfortable at first, then emerging soreness and energy-sapping discomfort by afternoon, then specific friction and rubbing by evening. This longitudinal pattern is exactly what a prosthetist needs but cannot see in a single appointment.
Anchor context to specific observations. Dated clinical notes and photograph thumbnails connect directly to the discomfort markers, creating a traceable evidence trail from observation to consultation.
Phase 3: Component Knowledge & Education
The right side of the infographic maps the educational layer.
Rotate and inspect 3D models. Interactive 3D component models allow users to explore physical motion axes and structural layers to build understanding prior to consultations. The wearer who understands the anatomy of their prosthesis asks better questions and gives more precise answers.
Explore recognized knee families. The infographic shows three Ottobock families — Genium (Genium A4), C-Leg (C-Leg 4), and Kenevo — with educational modules including details and manufacturer instructions for major systems.
Generalized educational boundaries. All 3D viewer geometries are generalized educational reference models — not body scans, custom fit representations, or measured pressure maps. This is education, not diagnosis.
Phase 4: Consultation & Care Continuity
The bottom-right panel closes the loop between daily documentation and clinical conversation.
Elevate fitting conversations. Assembling daily entries into a coherent narrative helps users and prosthetists review recorded trends together at equal eye level. The wearer arrives with structured evidence; the prosthetist receives actionable information instead of compressed verbal recall.
Private ownership and controlled sharing. Journal entries remain completely private to the user, with options to generate a temporary case link to share a specific concern via email token. Access is revocable. The record stays with the wearer.
Explicit non-diagnostic scope. The infographic states it plainly: STRIDE provides journaling and educational tools only. It does not diagnose conditions, prescribe sock changes, or assess device safety. Clinical decisions belong to the care team.
The visual thesis
The infographic reads left to right: learn the anatomy (Phase 1), document the daily experience (Phase 2), understand the technology (Phase 3), and carry the record into every consultation (Phase 4).
The gap in prosthetic care is not clinical expertise. It is patient voice. The prosthetist has the training to adjust the socket — but they need the wearer's structured observations to know what to adjust. STRIDE bridges that gap with a private ledger that turns lived experience into actionable evidence.
STRIDE is live and free to use.
Enter the SOMA Studio → — the research companion.

Richard Leclézio
Enterprise Transformation & AI Delivery Leader