SOMA: The Human Interface of Bionic Design
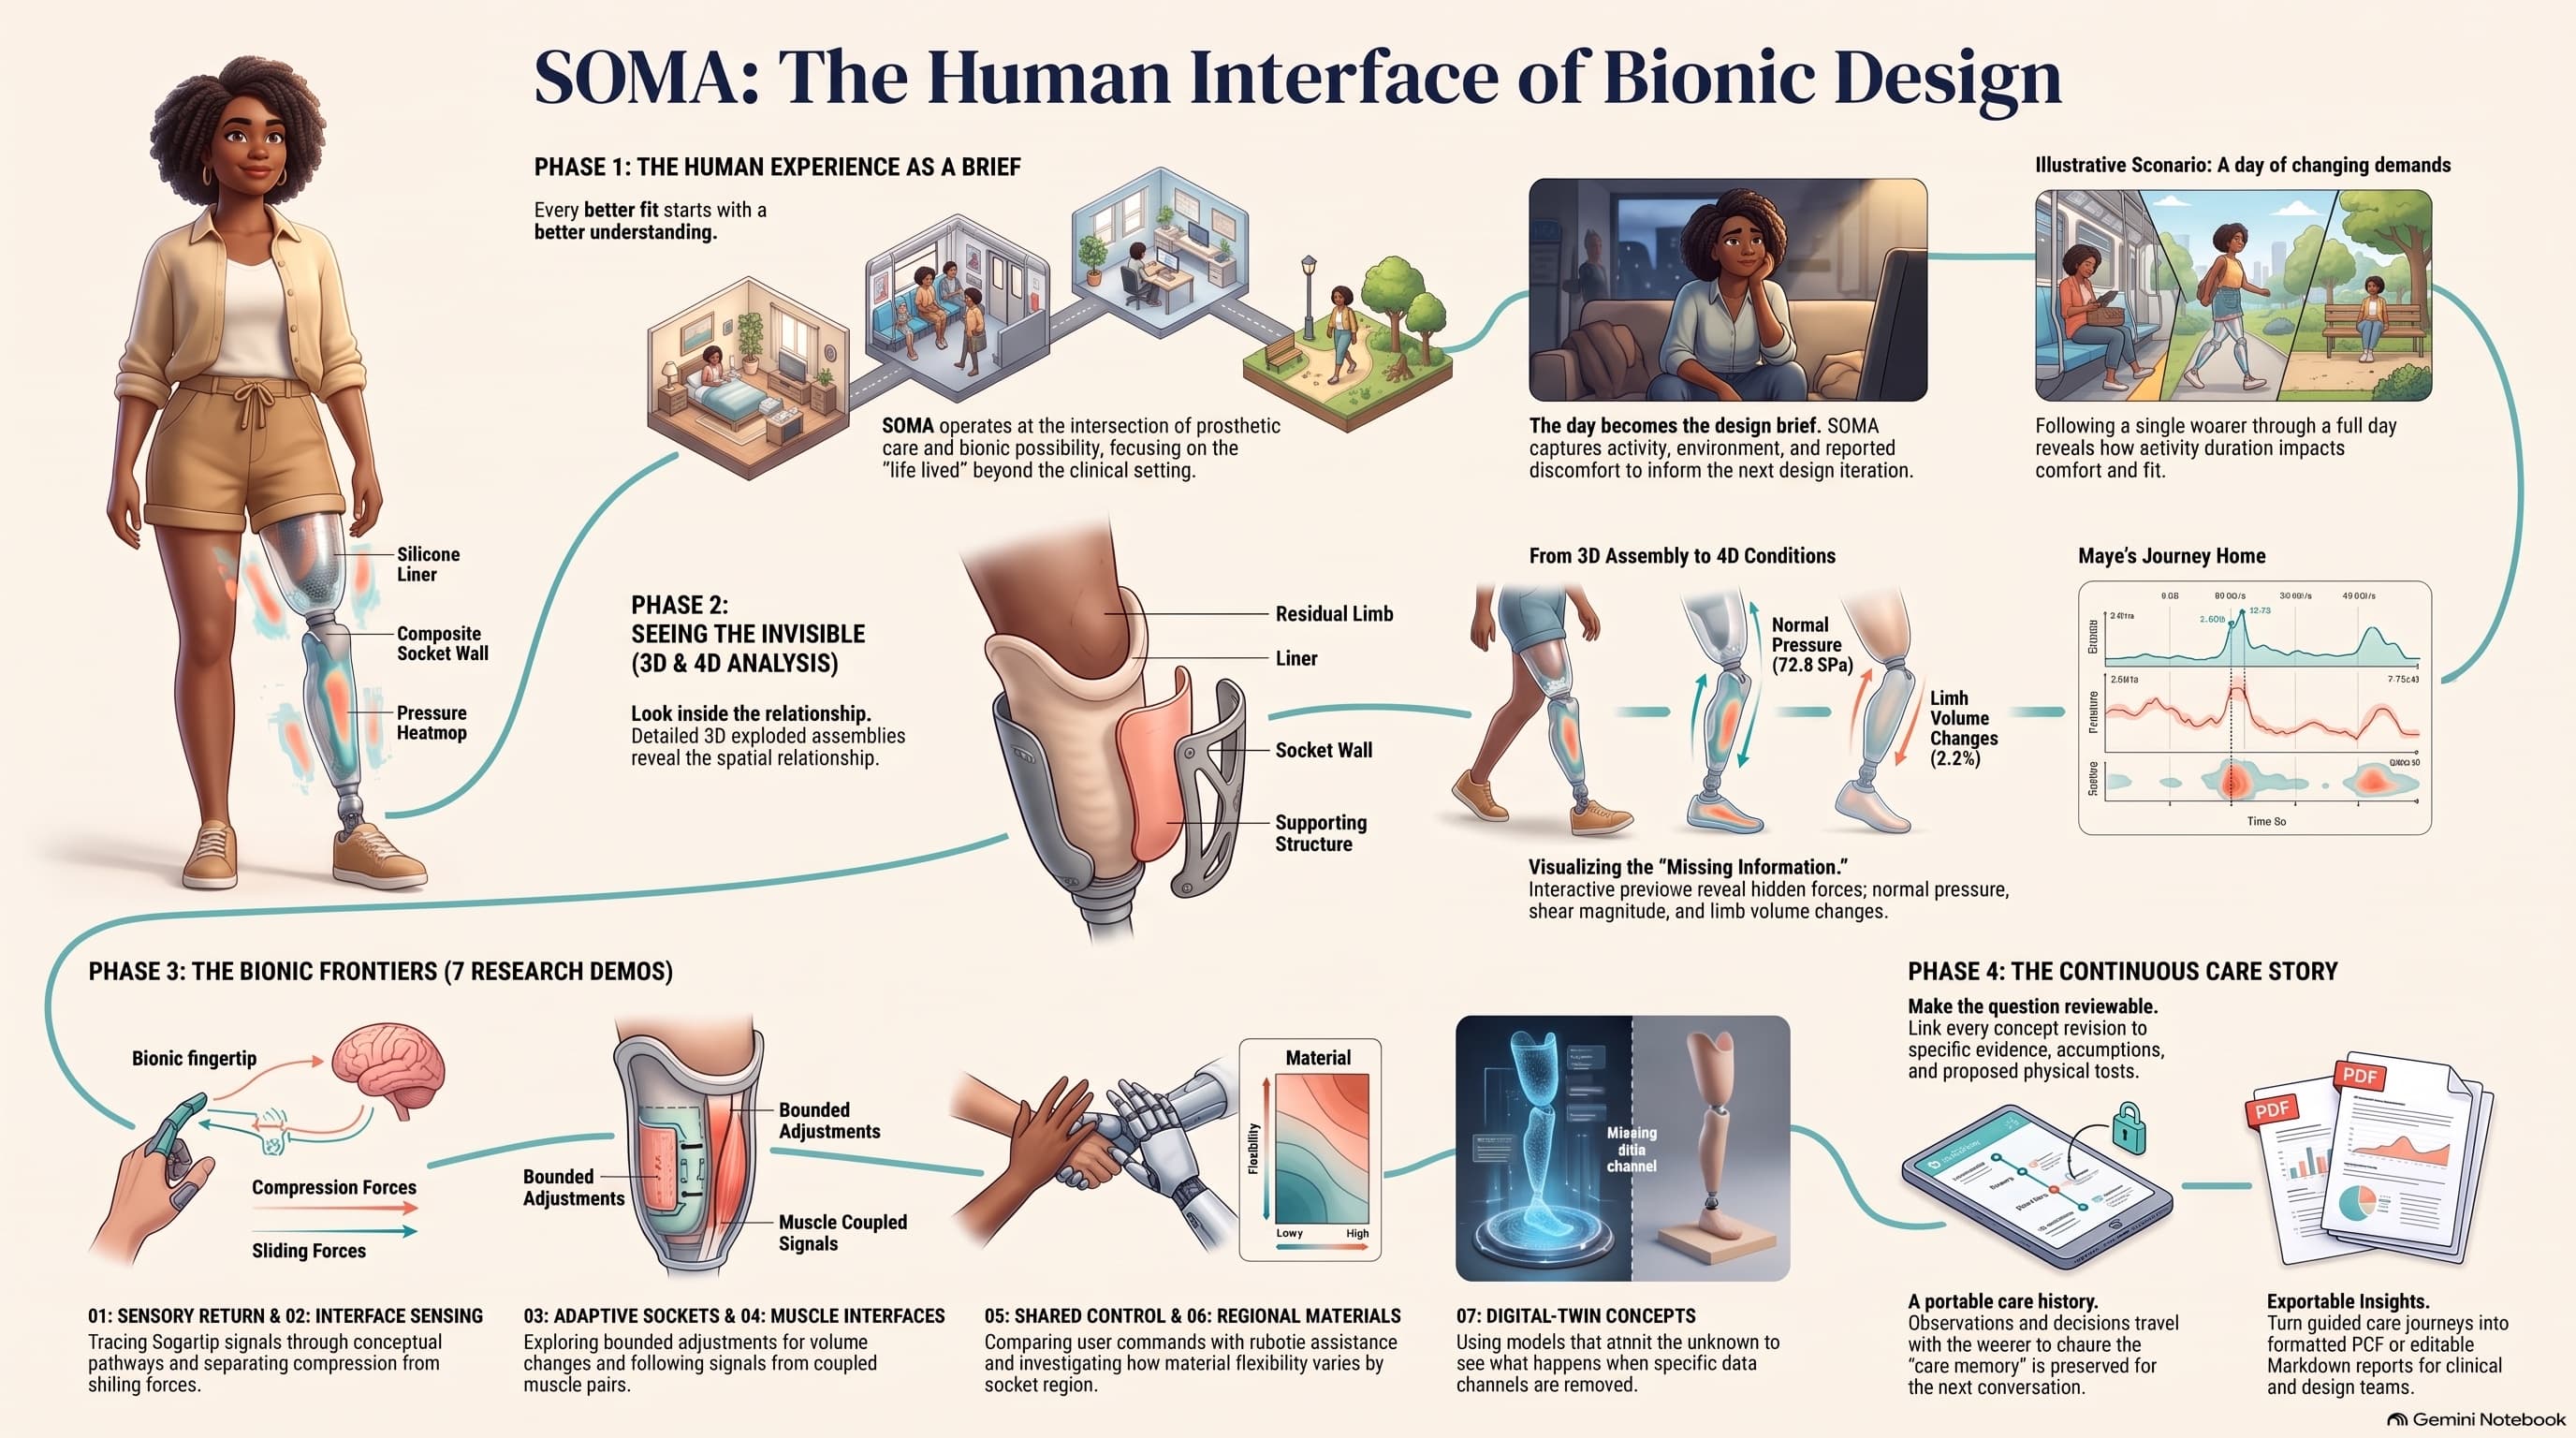
A visual blueprint of SOMA — the prosthetic care research prototype that centres design on lived experience. The infographic maps four phases: the human experience as a design brief, 3D and 4D analysis of the invisible forces at the limb-socket boundary, seven bionic research frontiers, and a continuous care story that travels with the wearer.
Most prosthetic infographics show the device. This one shows the person — and the four-phase methodology that makes the person's daily experience the starting point for every design decision.
SOMA is not a prosthetic product. It is a research and learning prototype. The infographic maps how it works: experience as brief, invisible forces made visible, seven research frontiers explored interactively, and a care memory that outlasts any single fitting.
Phase 1: The Human Experience as a Brief
The infographic begins at the top left with a principle: every better fit starts with a better understanding.
SOMA operates at the intersection of prosthetic care and bionic possibility, focusing on the "life lived" beyond the clinical setting. The day becomes the design brief — SOMA captures activity, environment, and reported discomfort to inform the next design iteration.
The top right illustrates this with Maya's journey home — an illustrative scenario tracking a single wearer through a full day to reveal how activity duration impacts comfort and fit. This is the shift: from a static fitting appointment to a dynamic, day-long understanding of how the prosthetic actually performs in the wearer's life.
The infographic labels the physical components — silicone liner, composite socket wall, pressure heatmap — but the emphasis is on what these components experience over time, not what they look like in a lab.
Phase 2: Seeing the Invisible (3D & 4D Analysis)
The centre-left of the infographic maps the inspection layer. The heading: look inside the relationship. Detailed 3D exploded assemblies reveal the spatial relationship between residual limb, liner, socket wall, and supporting structure.
The transition from 3D assembly to 4D conditions is the critical move. Static inspection shows what a design is. 4D replay shows what a design does — how normal pressure (72.8 kPa), limb volume change (-1.2%), and comfort shift across a full day of use.
The infographic calls this visualizing the "missing information" — interactive previews reveal hidden forces: normal pressure, shear magnitude, and limb volume changes. These are the forces that drive discomfort but remain invisible in standard clinical assessment. A clinician cannot see shear force during a fitting appointment. SOMA makes it visible in a replay.
Phase 3: The Bionic Frontiers (7 Research Demos)
The bottom-left panel maps all seven research demonstrations:
01: Sensory Return & 02: Interface Sensing — tracing fingertip signals through conceptual pathways and separating compression from sliding forces. The infographic shows a bionic fingertip with compression forces and sliding forces visualized separately — because the body distinguishes between them, and the interface should too.
03: Adaptive Sockets & 04: Muscle Interfaces — exploring bounded adjustments for volume changes and following signals from coupled movement. Adaptive sockets respond to the day's volume fluctuations rather than locking to a single measurement. Muscle interfaces couple residual muscle activity to prosthetic movement rather than relying on isolated signal detection.
05: Shared Control & 06: Regional Materials — comparing user commands with robotic assistance and investigating how material flexibility varies by socket region. Shared control blends what the wearer intends with what the environment demands. Regional materials optimize material properties zone by zone — rigid for load-bearing, flexible for comfort — rather than treating the socket as a uniform structure.
07: Digital-Twin Concepts — using models that admit the unknown to test what happens when specific data is absent or minimal. The infographic's caption is precise: models that admit the unknown. A digital twin that claims certainty where data is sparse is not a tool — it is a liability.
Phase 4: The Continuous Care Story
The bottom-right panel closes the loop with the care memory.
Make the question reviewable — tie specific revisions to specific evidence, documented and exportable. Every design change links back to the observation that motivated it.
A portable care history — observations and decisions travel with the wearer so the "care memory" is preserved for the next consultation. The infographic shows two export paths: formatted PDF for clinical and design records, or editable Markdown reports for ongoing collaboration.
Exportable insights — turn guided care journeys into formatted PDF or editable Markdown reports for clinical and design decisions. What worked, what changed, and why — carried forward to the next fitting, the next clinician, the next chapter.
The visual thesis
The infographic reads left to right, top to bottom: the person's experience defines the brief (Phase 1), invisible forces are made measurable (Phase 2), seven research frontiers are explored interactively (Phase 3), and the care story travels with the wearer (Phase 4).
The gap in prosthetic care is not technology. It is methodology. SOMA proposes that the starting point should be the person's day — not the socket's dimensions.
SOMA is live and free to explore.
Launch MedConsult AI → — clinical workflow platform.
Launch VITAL → — healthcare AI sandbox.

Richard Leclézio
Enterprise Transformation & AI Delivery Leader