The Cryptographic Gauntlet for AI Governance
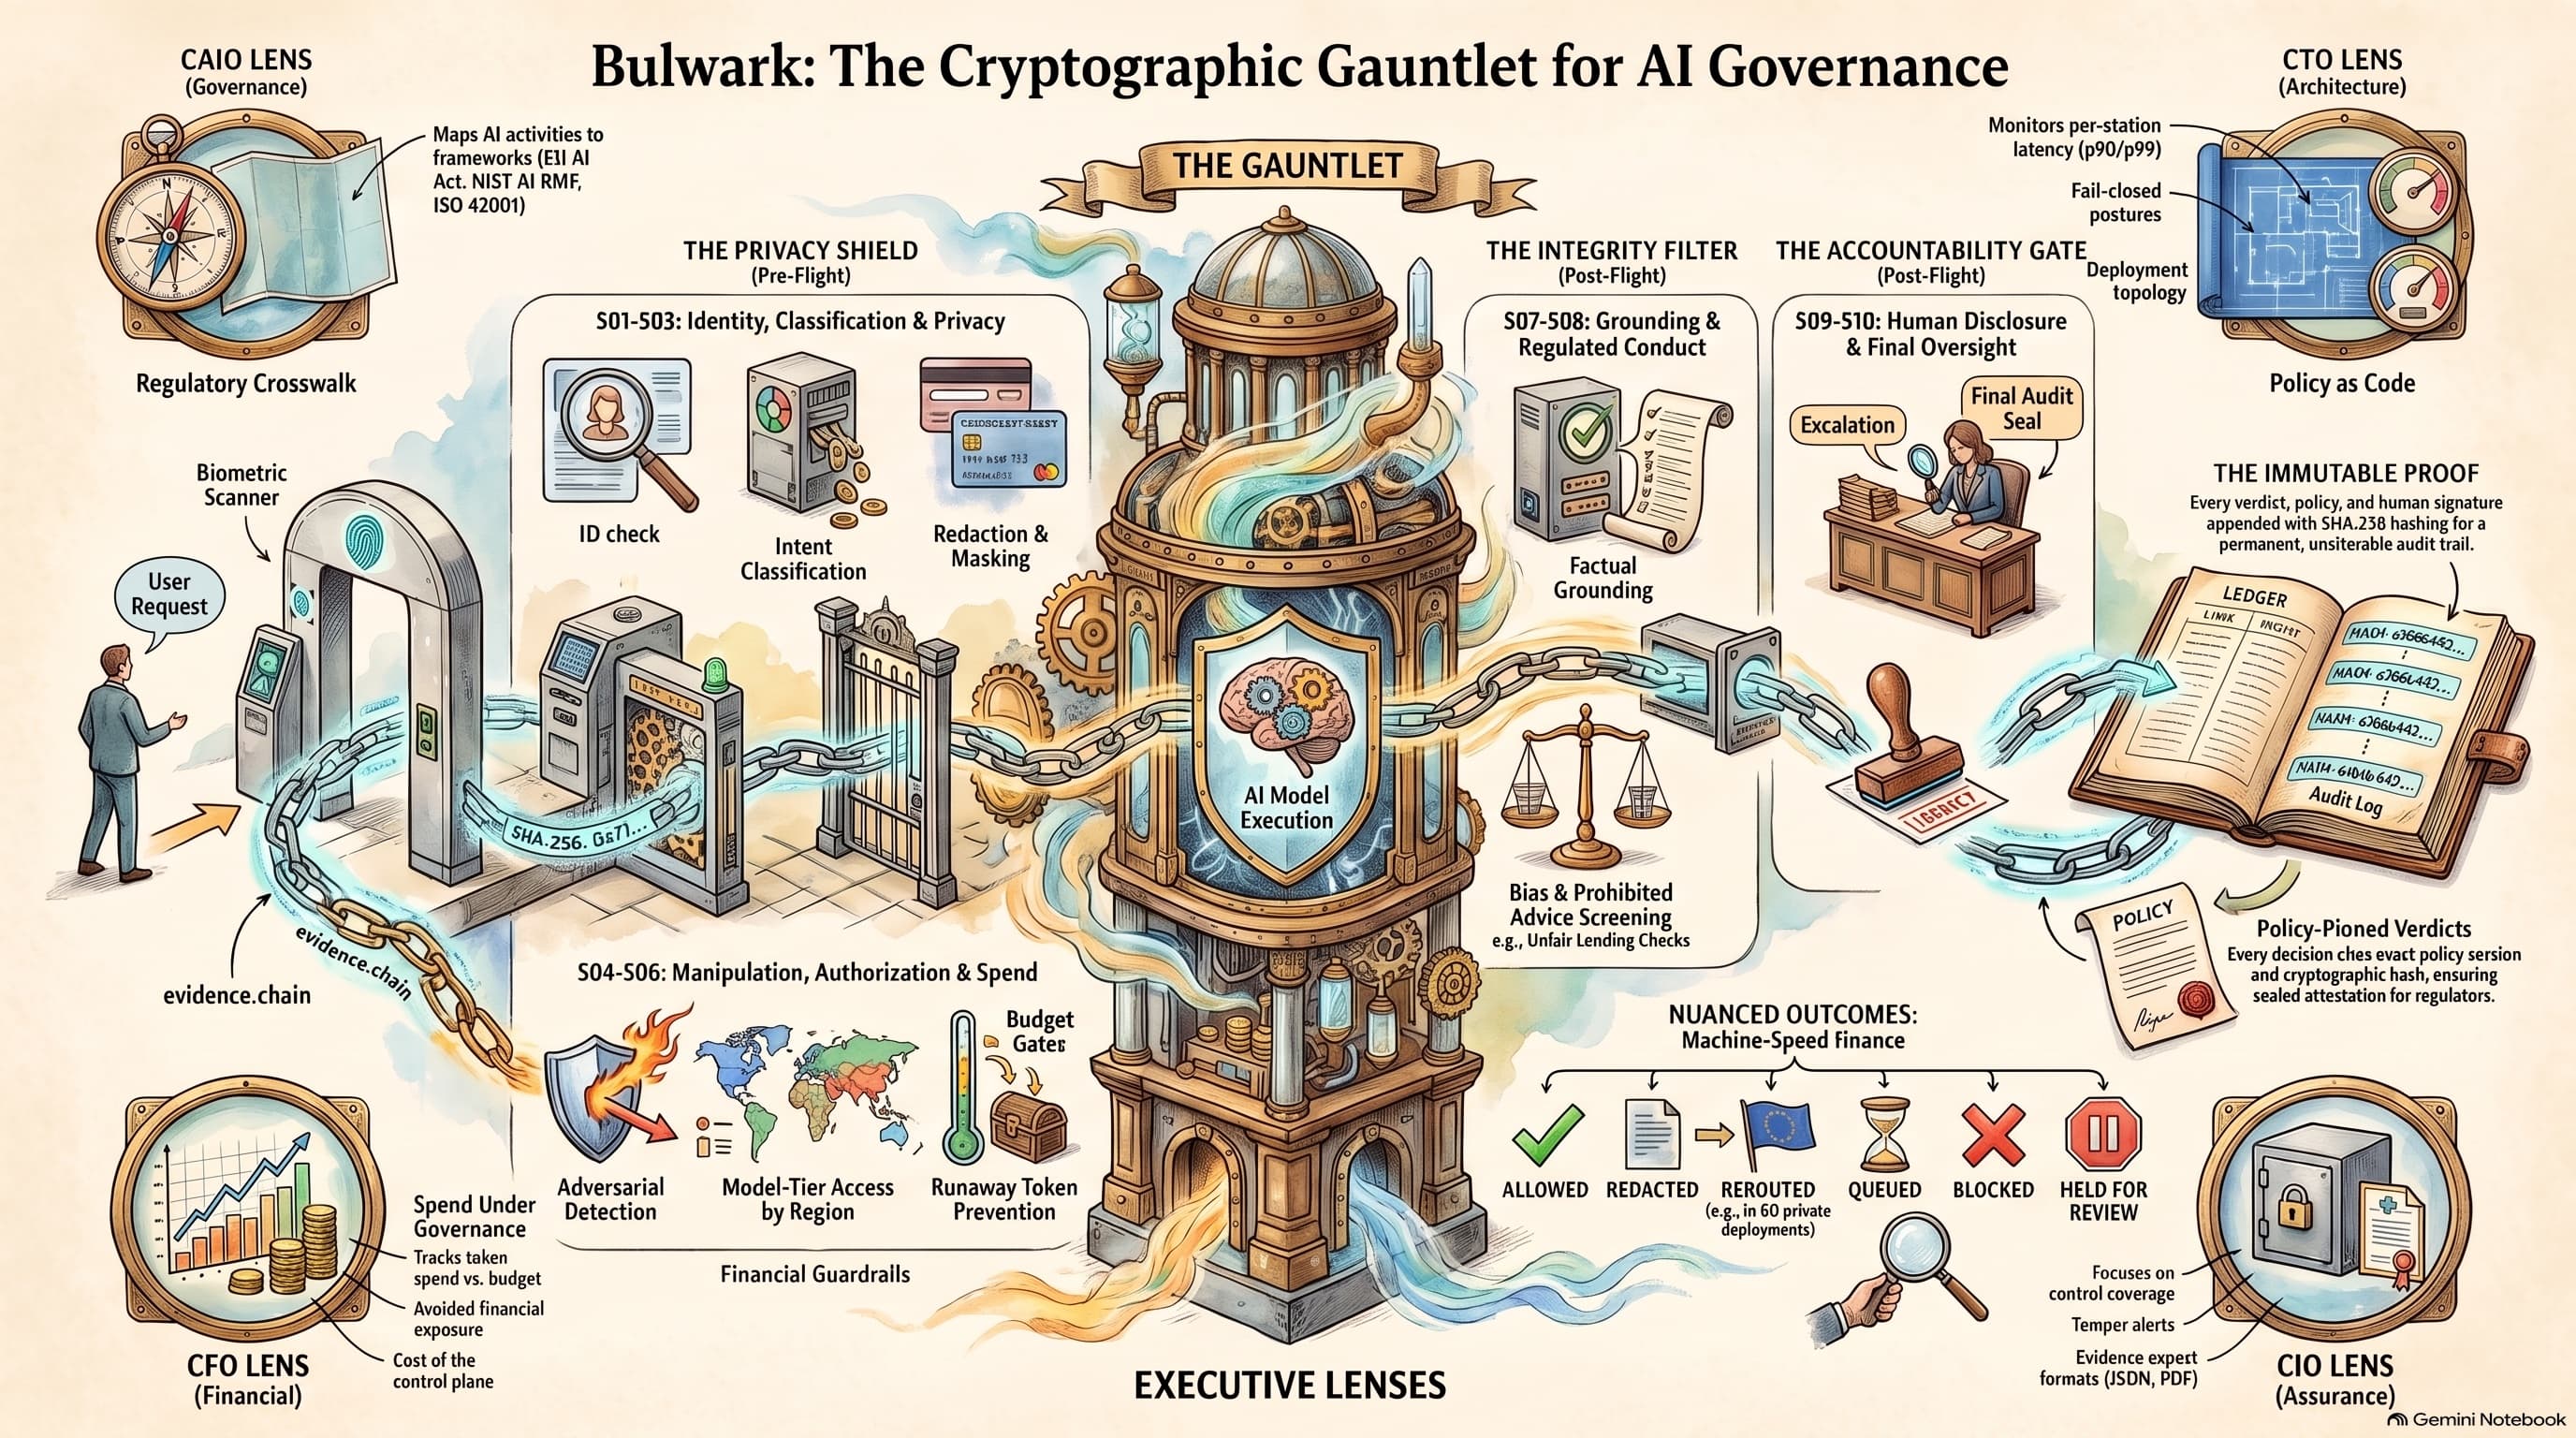
A visual blueprint of Bulwark — the runtime guardrail control plane that inspects every AI decision through ten stations before and after model execution. The infographic maps the gauntlet architecture, four executive lenses, seven nuanced outcomes, the immutable proof chain, and the regulatory crosswalk.
The infographic for Bulwark maps the entire architecture in a single visual: the gauntlet that every AI decision must pass through, the proof it leaves behind, and the four perspectives from which executives read the evidence.
This is not a marketing diagram. It is a technical blueprint rendered as a visual narrative — every station, every outcome, every lens, every hash.
The gauntlet
The centrepiece of the infographic is the gauntlet itself — a fortified structure through which every AI request passes, top to bottom, with no bypass.
The gauntlet is divided into three zones:
The Privacy Shield (Pre-Flight: S01–S03)
The first three stations handle identity, classification, and privacy before the request reaches any model.
S01 — ID Check. The user request enters through a biometric scanner metaphor. Identity is verified. Intent is classified. Prompt injection is screened at the gate.
S02 — Intent Classification. The request content is analysed for sensitivity. What kind of data does this request contain? What kind of response will it require?
S03 — Redaction & Masking. PII, credentials, and secrets are detected and masked before the request reaches the model. The infographic shows this as a physical filtering mechanism — the data passes through, but the sensitive elements are stripped.
The Financial Guardrails (Pre-Flight: S04–S06)
The middle stations govern manipulation, authorization, and economics.
S04 — Adversarial Detection. Manipulation screening for jailbreak patterns, social engineering vectors, and prompt attacks. The infographic positions this as a detection wall that the request must pass through.
S05 — Model-Tier Access by Region. Not every user accesses every model. Not every model runs in every region. Data sovereignty and tier-based access controls are enforced here.
S06 — Budget Gate / Runaway Token Prevention. Spend governance — the station that prevents a single query from consuming the budget. The infographic labels this as the "spend under governance" station, showing the connection between the request and the financial controls.
The Integrity Filter (Post-Flight: S07–S08)
After the model responds, the output passes through grounding and conduct verification.
S07 — Factual Grounding. Does the response cite real data? Does it reference regulations correctly? The grounding station verifies the output against the facts.
S08 — Bias & Prohibited Advice Screening. Fair lending checks. Regulated conduct rules. The infographic explicitly labels this as screening for violations — "e.g., Fair Lending Checks" — making the regulatory application concrete.
The Accountability Gate (Post-Flight: S09–S10)
The final two stations ensure human oversight and seal the decision.
S09 — Escalation. Consequential decisions are escalated to a named human reviewer. The infographic shows this as a disclosure mechanism — the decision is surfaced for human judgment.
S10 — Final Audit Seal. The human oversight station applies the audit seal. The named accountable human is recorded. The evidence chain entry is written.
The seven outcomes
The infographic maps all seven nuanced outcomes below the gauntlet — the machine-speed finance of AI decision governance:
- Allowed — request proceeds unmodified.
- Redacted — sensitive content masked.
- Rerouted — redirected to alternative deployment (e.g., EU-private instance for data sovereignty).
- Queued — held pending resource availability.
- Blocked — rejected entirely.
- Held for Review — requires named human reviewer (shown with an hourglass — "e.g., 6–10 min review coverage").
- Tamper alerts — evidence chain integrity violations detected.
The infographic makes the point visually: these are not binary allow/block decisions. Each is a specific operational response with a specific audit requirement.
The four executive lenses
The corners of the infographic map the four perspectives from which the same evidence chain is read:
CAIO Lens (Governance) — top left. Maps AI activities to EU AI Act, NIST AI RMF, ISO 42001. The regulatory crosswalk is embedded here — the CAIO sees compliance status, not technical detail.
CTO Lens (Architecture) — top right. Monitors per-station latency (p50/p99). Fail-closed posture verification. Policy-as-code version control. Deployment topology. The CTO sees the system's health.
CFO Lens (Financial) — bottom left. Spend under governance, token spend vs. budget, cost of the control plane, financial guardrails. The CFO sees what the guardrails cost and what they prevented.
Executive Lenses (combined) — bottom right. Evidence export in multiple formats (JSON, CSV, PDF). All four lenses read the same chain — no reconciliation required.
The immutable proof
The right side of the infographic maps the evidence architecture:
The Ledger — every verdict, hold, release, and seal is recorded in a SHA-256 hash-chained ledger. Each entry references the previous hash. The chain is tamper-evident by construction.
Policy-Pinned Verdicts — every decision cites the exact policy version and hash that was applied. Not "policy was in effect" — "policy version 3.2.1, hash a7f3c9, was applied at this station at this timestamp."
Evidence Export — the chain is exportable as JSON, CSV, or PDF. When the regulator asks for proof, the answer is a cryptographic chain — not a report.
The regulatory crosswalk
The infographic's CAIO lens explicitly maps the regulatory frameworks: EU AI Act, NIST AI RMF, ISO 42001. But the crosswalk is deeper than a label — it is embedded per station. When S08 screens for fair lending violations, the regulatory mapping to SR 11-7 and BCBS 239 is recorded in the evidence chain entry for that verdict.
The institution does not maintain a separate compliance tracking system. The compliance evidence is a byproduct of the control itself.
The visual thesis
The infographic's thesis is architectural: a request enters the gauntlet from the left, passes through ten stations, exits as one of seven outcomes on the right, and every step is sealed in an immutable proof chain readable from four executive perspectives.
Policy says what should happen. Bulwark proves what did happen. The infographic is the blueprint for how.
Bulwark is live and free to use.
Launch Sea Trial → — validate the guardrail stack before deployment.

Richard Leclézio
Enterprise Transformation & AI Delivery Leader